PetroStrategies, Inc. 
Topics 

bullet

Home

bullet

About Us

bullet

Classes

bullet

Graphs

bullet

Learning Center

bullet

Oil & Gas Value Chains

bullet

Oil & Gas Basics

bullet

Crude Oil Operations

bullet

Exploration

bullet

Drilling

bullet

Fracturing Operations

bullet

Production

bullet

Transportation

bullet

Refining

bullet

HF Alkylation Concerns

bullet

Marketing

bullet

Gasoline Taxes and Pump Prices

bullet

Gasoline Tool Kit

bullet

Running on Empty?

bullet

Deepwater Horizon Disaster

bullet

Natural Gas Operations

bullet

Exploration

bullet

Drilling

bullet

Fracturing Operations

bullet

Production

bullet

Transportation

bullet

Processing

bullet

Marketing

bullet

Industry Structure

bullet

Players

bullet

Corporate Taxes

bullet

People

bullet

International

bullet

Libyan Situation

bullet

The Middle East and North Africa in Turmoil

bullet

Student Reports

bullet

Statistics

bullet

Petroleum Facts at a Glance - API

bullet

U.S. Energy Information Administration

bullet

International Energy Agency

bullet

Independent Petroleum Association of America

bullet

National Petrochemical & Refiners Association

bullet

Energy Forecasts

bullet

Glossary

bullet

Oil & Gas FAQs

bullet

Oil & Gas Library

bullet

Oil & Gas DVDs

bullet

Oil & Gas Top Ten Lists

bullet

Photo Galleries

bullet

Offshore

bullet

Old Gasoline Stations

bullet

Teaching Resources

bullet

Links


PetroStrategies, Inc.

Plano,
Email

Web Site

Home | Contact | Feedback | Search | Site Map

Refined Product Marketing


Topics

  1. US Refined Product Demand

  2. Distribution Systems

  3. Gasoline Marketing

  4. Convenience Stores

  5. Refining and Marketing Economics

  6. References


How are Refined Products Sold?

After crude oil is converted into refined products, the products must be transported and sold to end-users.  


U.S. Refined Product Demand

Refined products are consumed throughout the United States.  For convenience, the country is divided into five Petroleum Administration for Defense Districts (PADDs).  The states included in each PADD are shown in the following table:

PADD

States

I Maine, Vermont, New Hampshire, Massachusetts, New York, Pennsylvania, Rhode Island, Connecticut, New Jersey, Delaware, Maryland, West Virginia, Virginia, North Carolina, South Carolina,  Georgia, Florida
II North Dakota, South Dakota, Nebraska, Kansas, Oklahoma, Minnesota, Iowa, Missouri, Wisconsin, Illinois, Michigan, Indiana, Ohio, Kentucky, Tennessee
III New Mexico, Texas, Arkansas, Louisiana, Mississippi, Alabama
IV Montana, Idaho, Wyoming, Utah, Colorado
V Washington, Oregon, California, Nevada, Arizona

The consumption of products in each PADD for 2008 is shown in the following table:

Consumption of Petroleum Products
(Thousands of Barrels per Day)

Products I II III IV V Total
Still Gas 61 130 321 25 132 669
Gasoline 3,211 2,539 1,360 291 1,563 8,964
Jet Fuel 593 281 121 53 469 1,518
Distillate Fuel Oil 1,256 1,220 757 181 524 3,938
Residual Fuel Oil 272 39 140 12 156 620
Asphalt & Road Oil 106 170 68 36 37 417
Petroleum Coke 51 132 168 24 70 445
Petrochemicals 30 43 467 0 5 544
Other Products 51 50 177 3 15 295
Total 5,631 4,604 3,579 625 2,971 17,410

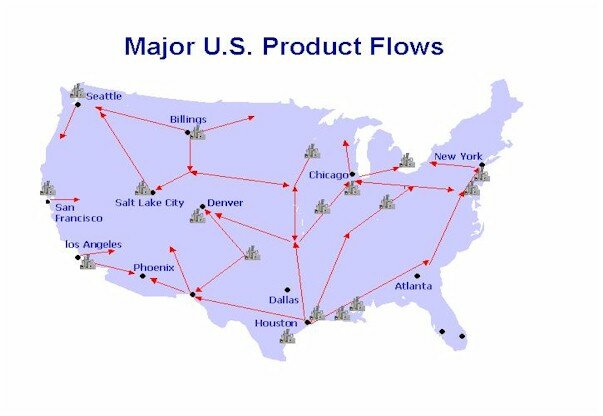
(Source: Products Supplied, Energy Information Administration)


Distribution Systems

In many cases refined products need to be moved from a PADD where there is excess supply to another PADD which needs more products.  This supply balance is illustrated in the chart.  PADD III refineries supply demand to the U.S. Midwest (PADD II) and East Coast (PADD I).  PADDs IV ( Rocky Mountains) and V (West Coast) are rather isolated from the rest of the nation and must largely be self-sufficient. 

Major US Refined Product Flows
Refinery to Retail Schematic

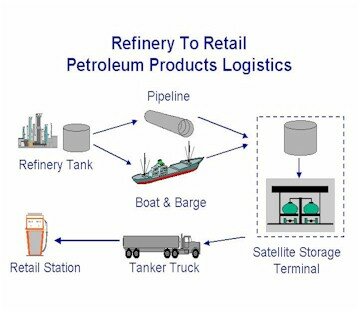
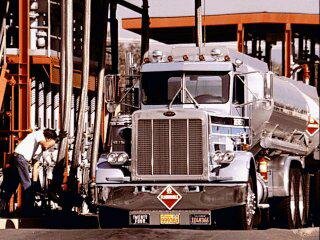
[Click on image to view full-size]

(Source: Mr. James Watson, Baker & O'Brien)

Refined products are moved to markets using pipelines, tankers and tank trucks.  Pipelines are the lowest cost method.  Colonial Pipeline Company ships products from refineries in the U.S. Gulf Coast (PADD III) to markets in the East and Northeast.  Colonial Pipeline Co. is an interstate common carrier of petroleum products. Each day, Colonial delivers an average of 80 million gallons of gasolines, kerosenes, home heating oils, diesel fuels and other fuels to terminals in 12 states and the District of Columbia.  The 5349-mile system transports fuels from Texas, Louisiana, Mississippi and Alabama to 267 marketing terminals located near the major population centers of the Southeast and Eastern Seaboard. It is owned by BP (17.96%), CITGO Petroleum (15.79%), Conoco (8.53%), Equilon (16.12%), Koch Industries (7.30%), Marathon Oil Company (2.82%), Phillips Petroleum (8.02%) and Union Oil Company of California (23.44%).

Waterborne tankers move products from U.S. Gulf Coast ports to destinations along the Gulf Coast from Texas to Florida and East Coast from Washington to Boston.  

Gasoline TerminalOnce the products reach their destination, which is usually a supply terminal, they are distributed to gasoline stations, airports and homes by tanker trucks. Companies mix their additive packages into gasoline at these facilities.


Go to the Topic Listing


Gasoline Marketing

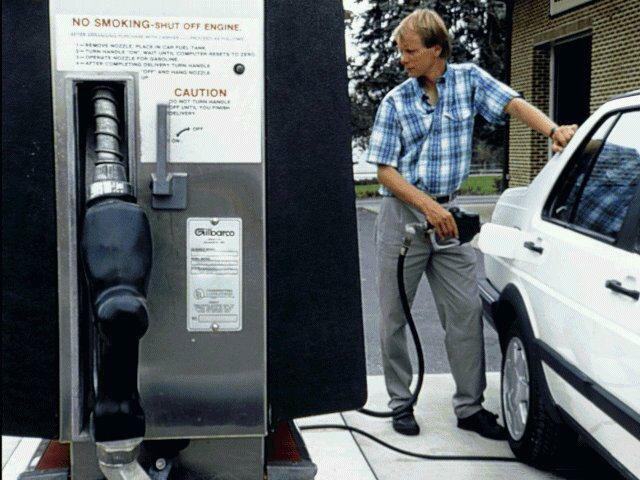
Perhaps the most visible refined product is gasoline.  Over 180,000 gasoline stations deliver transportation fuels to motorists throughout the United States. 

Gasoline FillupGasoline is sold at branded and unbranded stations.  Branded stations include company-owned, distributors and dealers. Company-owned stations are Owned and operated by a petroleum refining company (e.g. ExxonMobil, Chevron, etc.) Company owned stations usually have a higher focus on fuel sales versus convenience store merchandise sales. Distributors are companies without refining operations that own and operate their own gas stations.  

Distributors may also supply gasoline to  dealers who are independent gasoline stations that have no distribution capabilities. Branded operations allow distributors and dealers to market gasoline under a recognized brand. Unbranded stations are retail or commercial.   

The following table contains statistics for the companies in the EIA's financial reporting system.

  2006 2007
Number of Retail Outlets    
Dealer Outlets 30,870 30,226
Company Operated Outlets 7,927 7,642
Total Retail Outlets 38,797 37,868
Average Monthly Outlet Volume    
Dealers 93.9 92.0
Company Operated 215.1 193.6

(Source: Table 16, Refining and Marketing - Performance Profiles of Major Energy Producers 2007)

Retail establishments include companies such as chains such as RaceTrac and QuikTrip, "mom and pop" stations, and major retail marketers such as Wal-Mart and Cosco. Commercial operations are for fleet programs and construction operations.

Please click on the link to see some photographs of old time gasoline stations.

Go to the Topic Listing


Convenience Stores

Convenience stores or C-stores represent a growing trend in retail operations.  Data compiled by the National Petroleum News indicates the nature of C-store operations.  

Category

Average 

Full C-Stores with more than 1,000 sq. feet, % 92%
Sell Gasoline, % 93%
Offer Car Wash, % 10%
Average Full C-Store Non-Gasoline Sales Volume, $/Month $87,408
Average Full C-Store Non-Gasoline Sales Volume, $/Month $23,973
Offer Deli, % 43%
Offer Branded Fast Foods, % 10%
Sell Alcohol, % 65%
Sell Tobacco, % 92%
Sell Lottery Tickets, % 74%

Go to the Topic Listing


Refining and Marketing Economics

The average gross refining/marketing margin reported by companies in the EIA's financial reporting system increased 2% in 2007 to $12.25/B.  The net refining margin decreased to $4.78/B. 

Prices in 2007 $/B 2006 2007
Gasoline Average Price 86.04 92.62
Distillate Average Price 85.48 91.31
Other Products Average Price 58.60 62.20
All Refined Products Average Price 80.97 86.78
Less: Raw Materials and Product Purchases 68.98 74.53
Equals: Gross Refining Margin 11.99 12.25
Less: Operating Costs 7.01 7.47
Equals: Net Refining Margin 4.98 4.78
Reseller/Wholesale Spread
(dealer price-wholesale price)
3.53 3.59
Retailer Spread
(company-operated price-dealer price)
5.01 5.70

(Source: Table 13, Refining and Marketing - Performance Profiles of Major Energy Producers 2007)

Net refined product margins decreased in 2007 to $4.78/B as a result of higher costs as shown in the following table.

Prices in 2007 $/B 2006 2007
Gross Margin 11.99 12.25
Less: Marketing Costs 1.45 1.67
Less: Energy Costs 1.79 1.93
Less: Other Operating Costs 3.77 3.87
Subtotal 7.01 7.47
Equals: Net Margin 4.98 4.78

(Source: Table 14, Refining and Marketing - Performance Profiles of Major Energy Producers 2007)


References

For more information about refined product marketing, please check out the following references:

bullet

Petroleum Marketers Association of America (PMAA) is a federation of 42 state and regional trade associations representing 7,850 independent petroleum marketers nationwide. Most of  these marketers are small, family businesses serving the petroleum needs of their local community.  These companies sell approximately half the gasoline, 60% of the diesel fuel and 80% of the home heating oil consumed in America annually. 

bullet

What is a Service Station?, Chevron Corporation

bullet

Restructuring: The Changing Face of Motor Gasoline Marketing

bullet

The U.S. Petroleum Refining and Gasoline Marketing

bullet

National Association of Convenience Stores

bullet

Changing Competitive Environment for Gasoline Marketing

bullet

Gasoline Facts & Tips - Retail Marketing

bullet

Gasoline Tool Kit

bullet

The US Petroleum Refining and Marketing Industry - Energy Information Administration

bullet

The Economics of Gasoline Retailing - American Petroleum Institute

bullet

Refining and Marketing - Performance Profiles of Major Energy Producers 2007

Go to the Topic Listing


Copyright 2000
PetroStrategies, Inc.
All Rights Reserved